Originally published on the InterWorks blog.
Apache Spark has emerged as a significant technology in the data analytics field. The platform processes big data, machine learning, and streaming information. Tableau offers native connectivity to Spark SQL, enabling users to query tables using standard SQL syntax. At its foundation, Spark “can ingest data from many different sources (typically Hadoop) and pull data into memory for faster processing speeds.” When memory limits are reached, Spark writes temporarily to disk to maintain performance.
The Challenge for Tableau Developers
While connecting Tableau to Spark SQL may seem straightforward, implementing a complete pipeline from raw data sources to visualization requires more than simply linking a spreadsheet. This article demonstrates a practical workflow using Google N-Grams data on Amazon Web Services infrastructure.
Step 1: Loading Data into Hadoop
The first phase involves transferring S3 data into Hadoop Distributed File Store using MapReduce. The example employs Google’s N-Grams dataset — specifically single-word entries tracking frequency across years. The command uses Hadoop streaming without requiring explicit .jar file paths on EMR:
$hadoop-streaming \
  -D mapred.reduce.tasks=0 \
  -input s3n://datasets.elasticmapreduce/ngrams/books/20090715/eng-all/1gram/ \
  -inputformat SequenceFileAsTextInputFormat \
  -output ngrams \
  -mapper /bin/cat
Verification occurs through standard HDFS commands confirming successful data transfer.
Step 2: Configuring Spark-Hive Integration
Before launching PySpark, the Hive configuration must be copied to Spark’s configuration directory. This enables interaction with the Hive metastore — essential for exposing tables to Tableau:
$cp /user/lib/hive/conf/hive-site.xml /usr/lib/spark/conf/Step 3: Creating Tables with PySpark
PySpark’s command-line interface allows developers to process raw data and establish queryable tables. The workflow involves reading text files, applying schema definitions, and caching results:
text = sc.textFile("1gram")
text2 = text.map(lambda x: x.split("t"))
df = sqlContext.createDataFrame(text2, ['index', 'ngram', 'year', 'occurrences', 'pages', 'books'])
df.saveAsTable("one_gram_table")
df.cache()
Subsequent filtering creates specialized tables for focused analysis:
alex_alexander = sqlContext.sql("SELECT * FROM one_gram_table WHERE ngram = 'Alex' or ngram = 'Alexander'")
alex_alexander.saveAsTable("alex_and_alexander")
Step 4: Starting the Thrift Server
The Thrift server enables remote SQL queries from Tableau. Configuration parameters manage memory allocation and port assignment:
$sudo /usr/lib/spark/sbin/start-thriftserver.sh \
  --master yarn \
  --conf spark.ui.port=4049 \
  --executor-memory 8G \
  --num-executors 5 \
  --driver-memory 4G \
  --hiveconf hive.server2.thrift.port=9999
The non-default port (9999) prevents conflicts with Hive’s standard port 10000. Elevated memory settings provide stability during demanding queries.
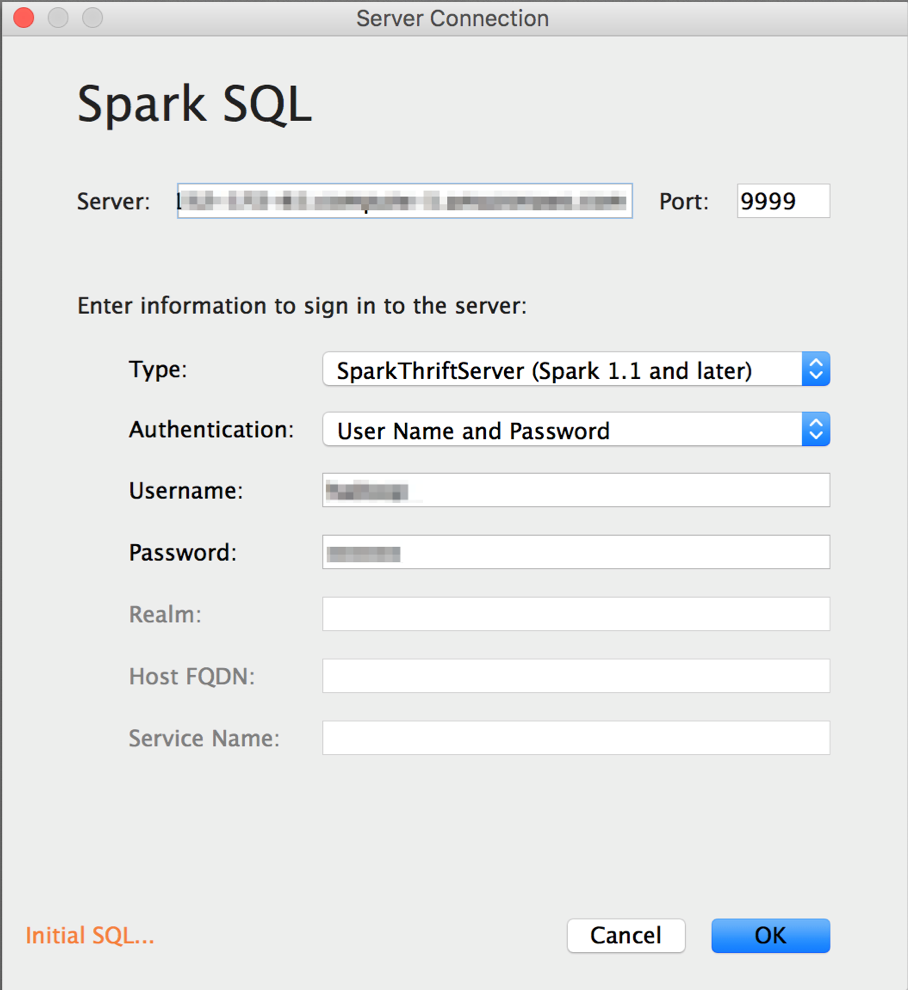
Step 5: Connecting Tableau
With tables prepared and the server active, Tableau connection requires entering the AWS Public DNS address and matching port number. Security group configurations must permit traffic from the analyst’s machine.
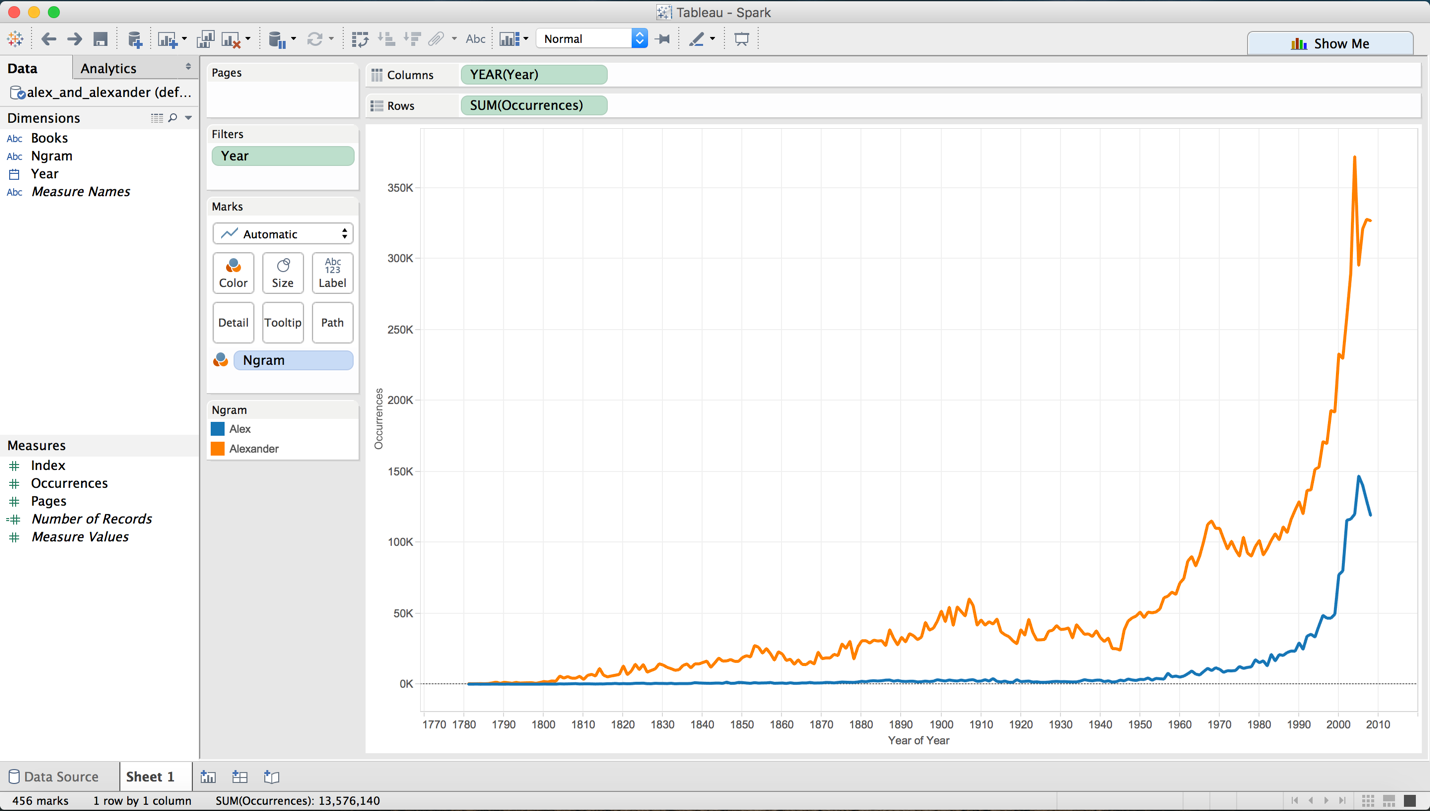
Once connected, Tableau functions normally against Spark SQL tables, enabling standard visualization and analysis workflows.
Conclusion
Integrating Spark SQL with Tableau initially appears complex but becomes manageable with structured implementation. This approach can be an easy way to access big data sets and analyze them using a familiar tool once set up correctly. As a demonstration, I used the completed pipeline to visualize a time-series comparison of the frequency of the names “Alex” and “Alexander” across published books — a fitting end to a project this personal.