Originally published on the InterWorks blog.
It was Game 7 of the 2003 American League Championship Series. The Red Sox were leading the Yankees 5–2 in the eighth inning. Pedro Martinez — one of the greatest pitchers of his generation — was on the mound. The data was clear: after 106 pitches that season, Pedro’s Opponent Batting Average spiked 64 points to .370. The numbers said it was time to go to the bullpen.
Red Sox manager Grady Little left him in anyway. His justification: “I did what I always do.”
Pedro gave up the tying run. The Yankees won in extra innings on an Aaron Boone walk-off home run. The Red Sox went home. Grady Little was fired. And this story became one of the most cited examples of what happens when decision-makers rely on gut instinct over available data.
Quite often, we make decisions with our gut instinct or our memory of the recent past. Data science exists to give us something better. But data science alone isn’t enough — because even if the analysis exists, decision-makers often can’t access it in the moment they need it. That gap is what operationalization closes.
Operationalization: The Last Step
Operationalization is the last and final step in the data science life cycle — the step that enables end users to understand analysis as the data and situations change. Without it, data scientists end up repeatedly rerunning models every time a leader asks “but what if we change the discount?” Interactive applications eliminate that loop entirely.
An Easier Way
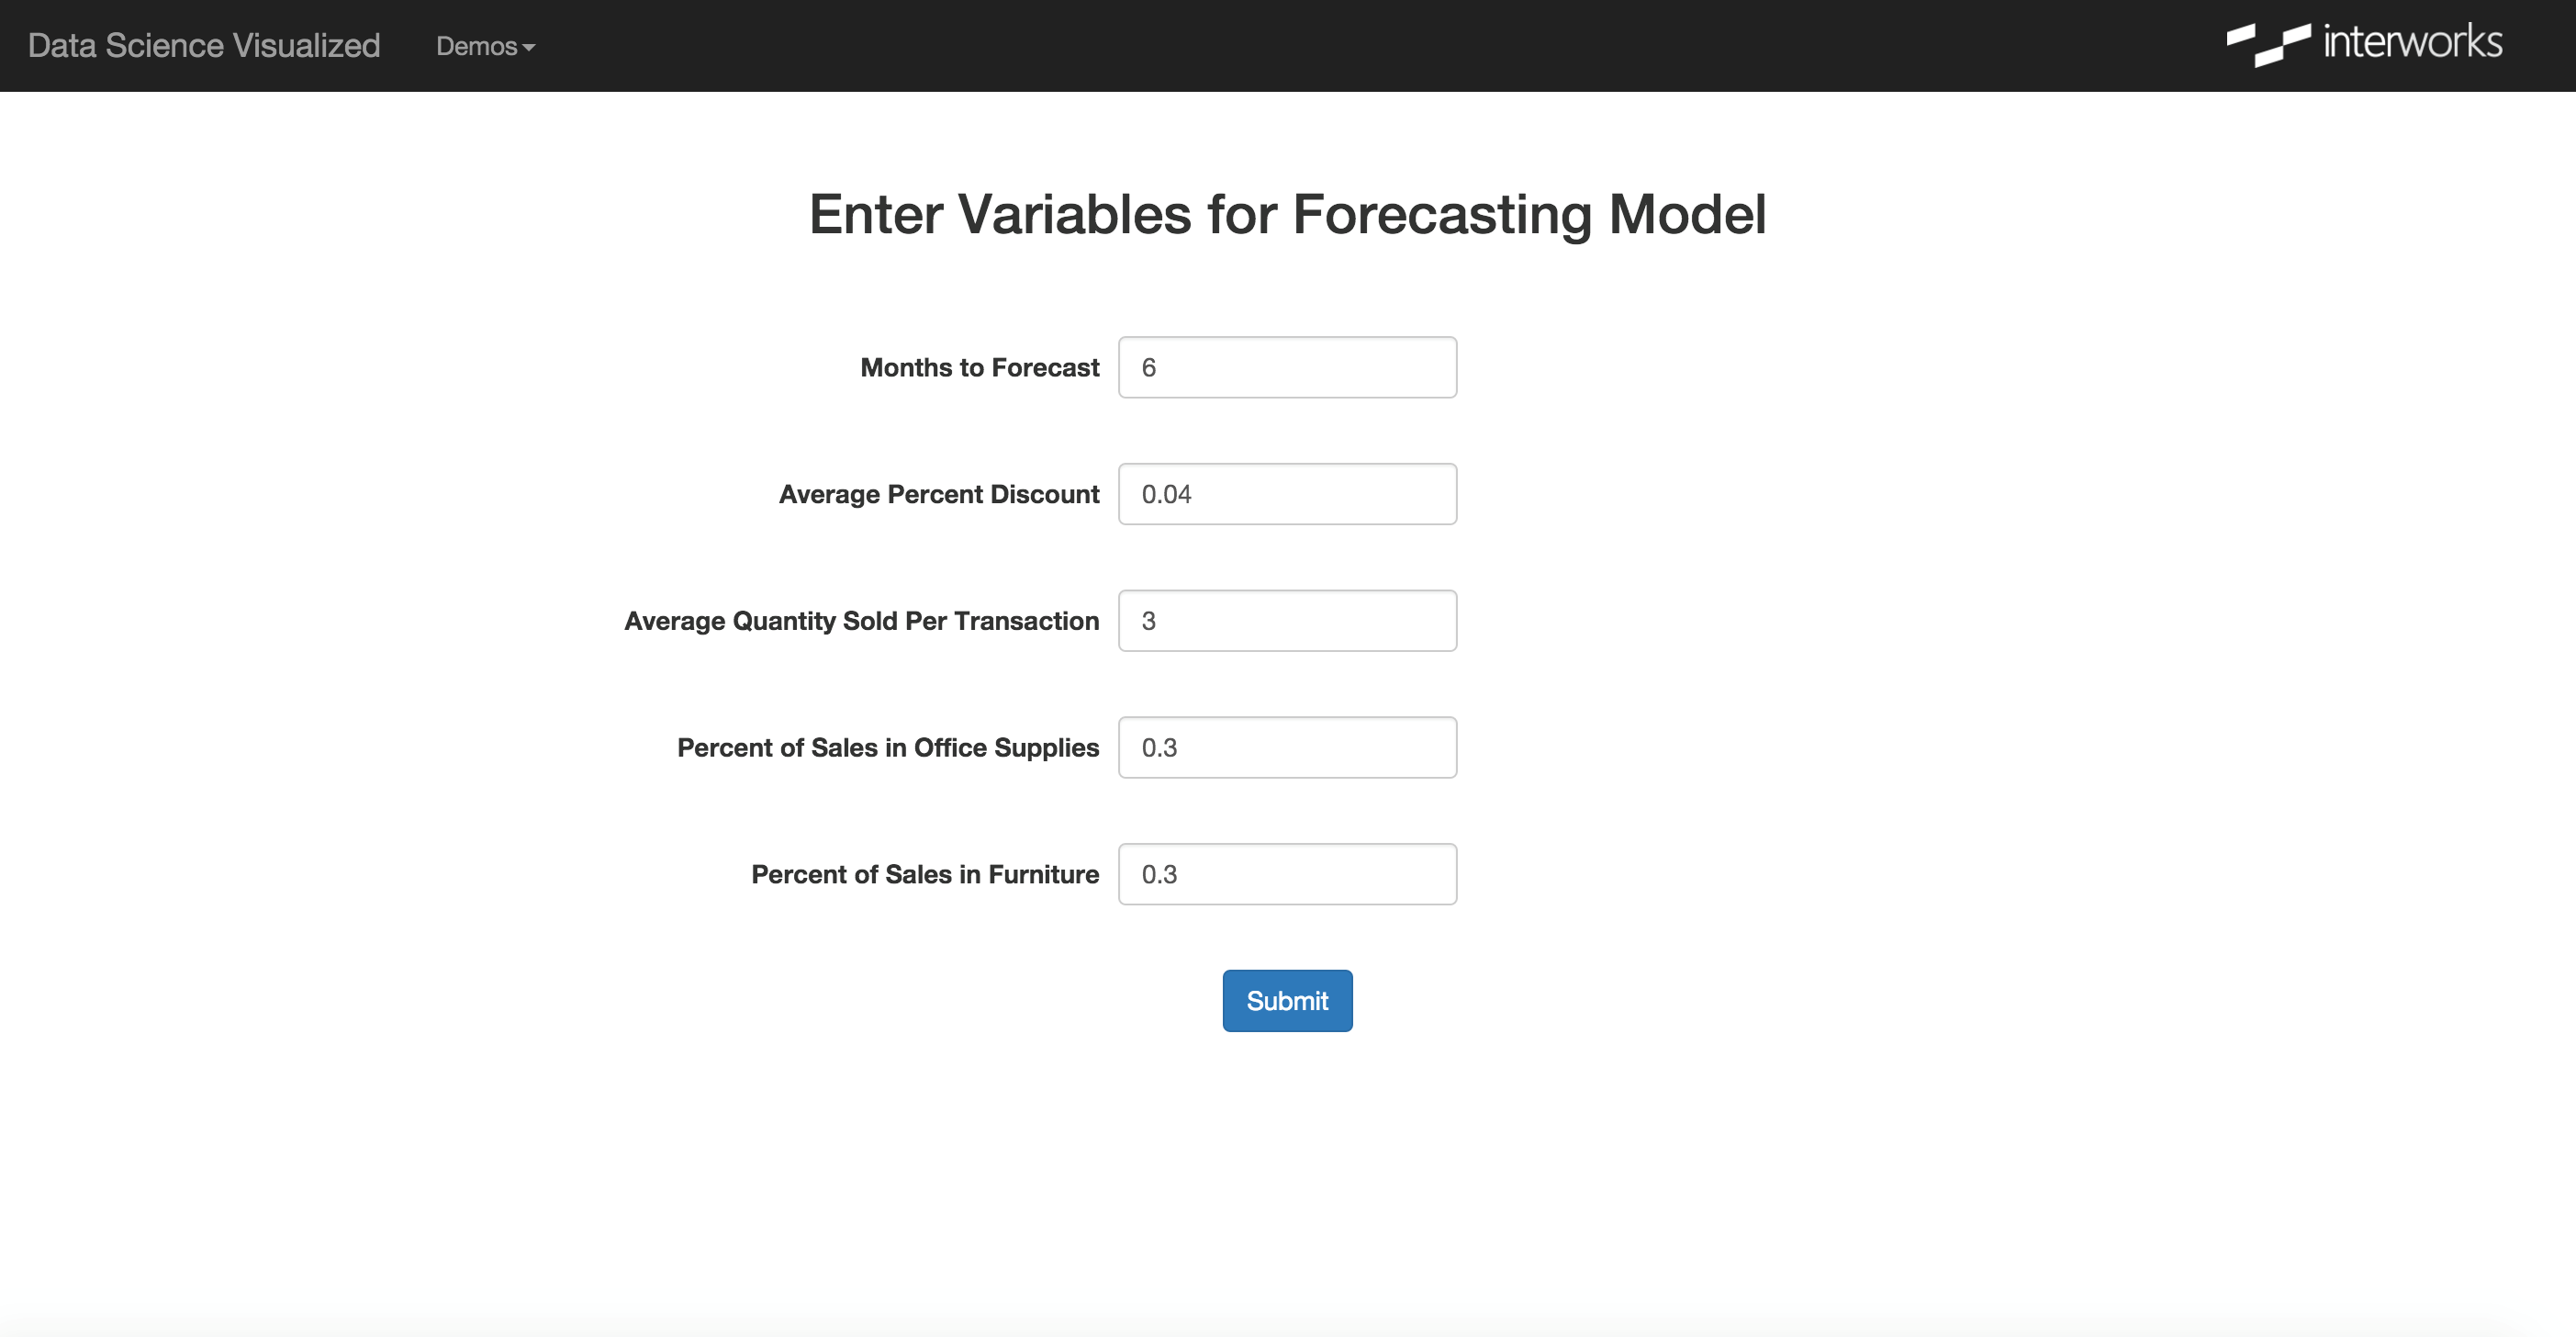
Consider a sales forecasting model. Leadership wants to understand how changes to product mix or average discount affect future revenue. Without an operationalized system, a data scientist manually reruns the model for each scenario. With one, a decision-maker adjusts inputs in a web form and sees updated forecasts instantly — no data scientist required.
That’s the goal: make the predictions accessible, meaningful, and fast.
Building the Data Science Portal
The technical implementation uses four components working together:
Python Flask powers a lightweight web application — the “Data Science Portal” — that collects user inputs through a web form. Users specify forecast duration, average discounts, and product mix variables. Flask is one of many viable frameworks; the approach generalizes to whatever your organization uses.
R scripts receive the inputs from Flask and execute the predictive modeling. R handles the statistical heavy lifting and writes results to the database.
PostgreSQL stores the outputs. Each user receives a unique key so that in a multi-user environment, the dashboard only shows results generated by that specific user’s inputs.
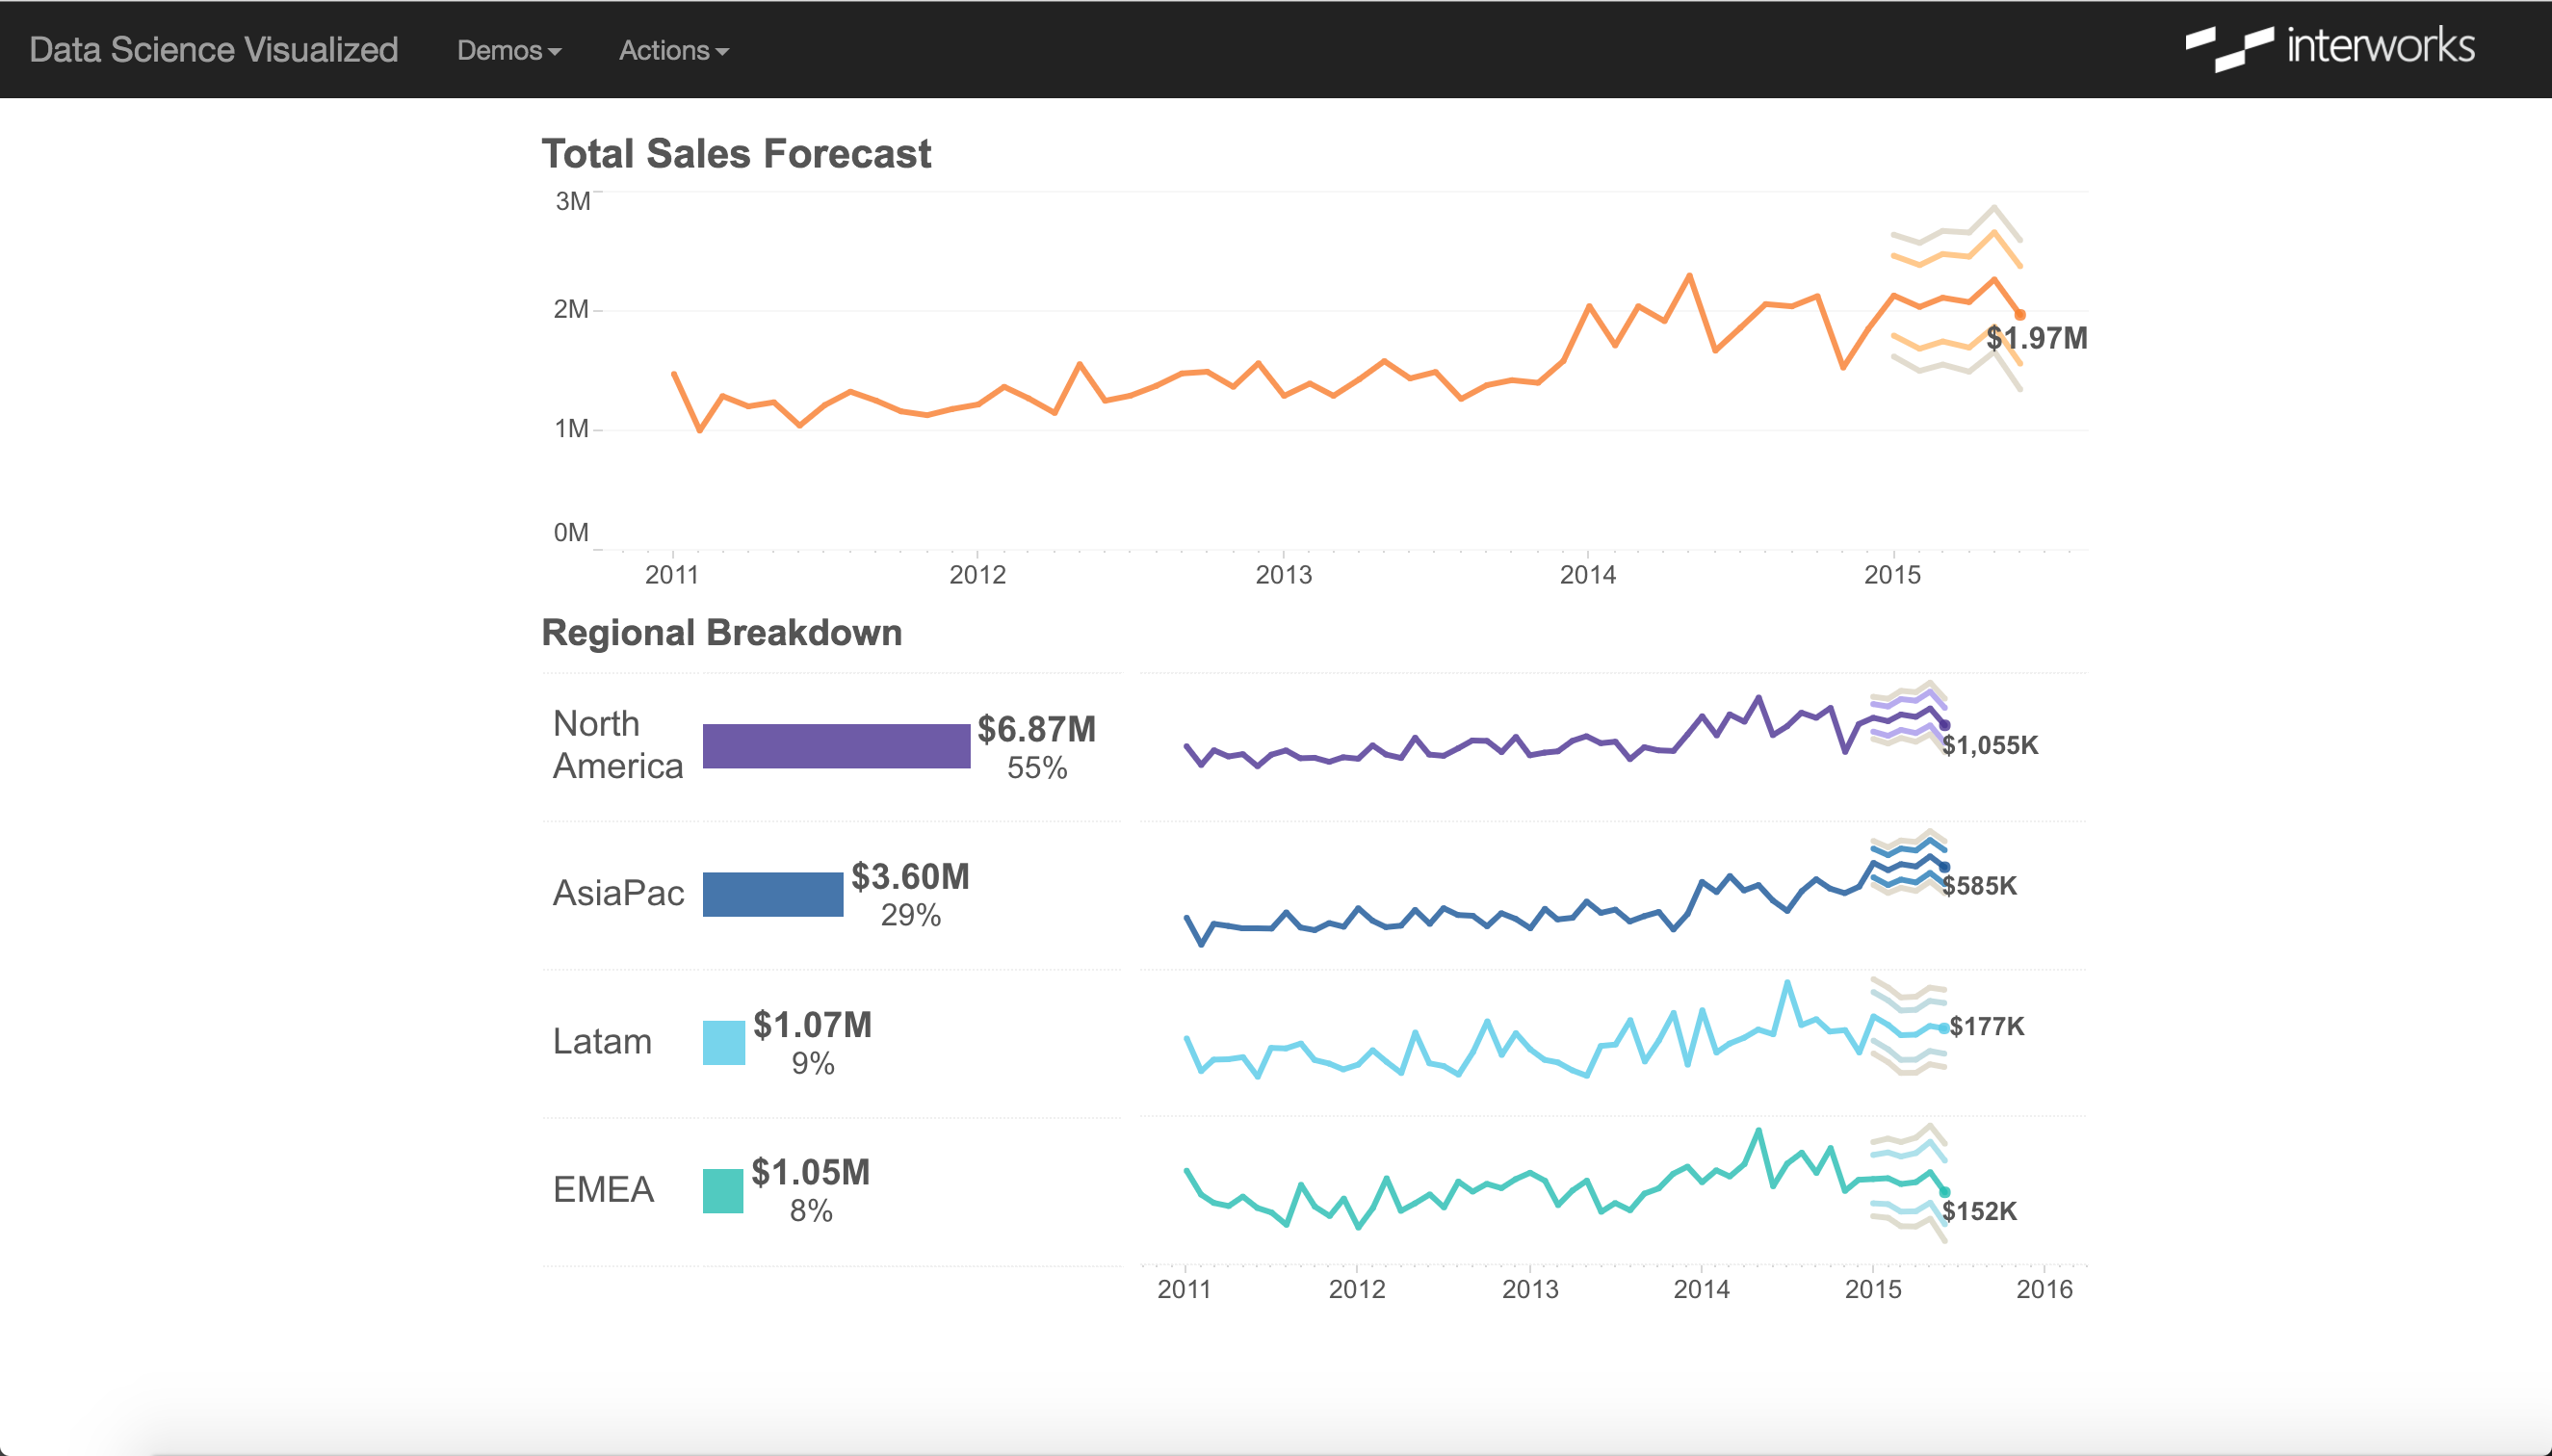
Tableau Server connects to Postgres and renders the forecast visualization, embedded directly in the web application via the Tableau JavaScript API and filtered by the unique user key.
From the end-user’s perspective, the process is invisible: enter inputs, see results. The entire pipeline runs in the background. This matches the expectation modern analytics platforms have established.
Preventing Future Grady Littles
The objective of data science is to shift organizations from “I did what I always do” to informed, data-driven decisions. But that shift only happens if decision-makers can actually access the analysis when they need it.
Data scientists must embrace modern ways of presenting their work — quick, meaningful, and adaptable. Operationalized applications are how we stop enabling Grady Little.